nyxr's web UI shows the scan
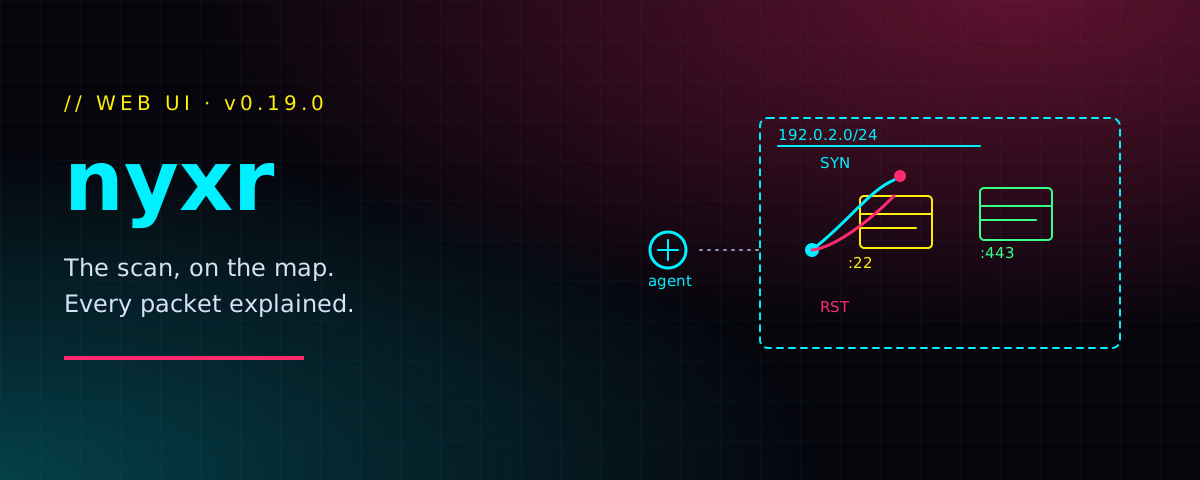
When I wrote the nyxr project page it tracked v0.17.1. nyxr serve already ran an unprivileged web UI at http://127.0.0.1:8484, and that UI was already only a client of the REST API. The screen was a dashboard of counts, a scan form, tables of observations and a hex editor for live frames. v0.18.0, published on 27 October 2026, added the HORIZON page. v0.19.0, published on 4 November 2026, replaces the dashboard. Source is matusso/nyxr. The UI is embedded in the nyxr binary.
/24 or /64 frames, and the packets of the scan drawn between them, live or as a replay. Click a packet for a field-by-field explainer. Values the scan did not record are badged E.G. Search sits in the top bar. A service claim can be followed to its exchanges, its capture status and an editable probe. Light and dark follow the system until you pick one. v0.18.0 had already added the HORIZON page.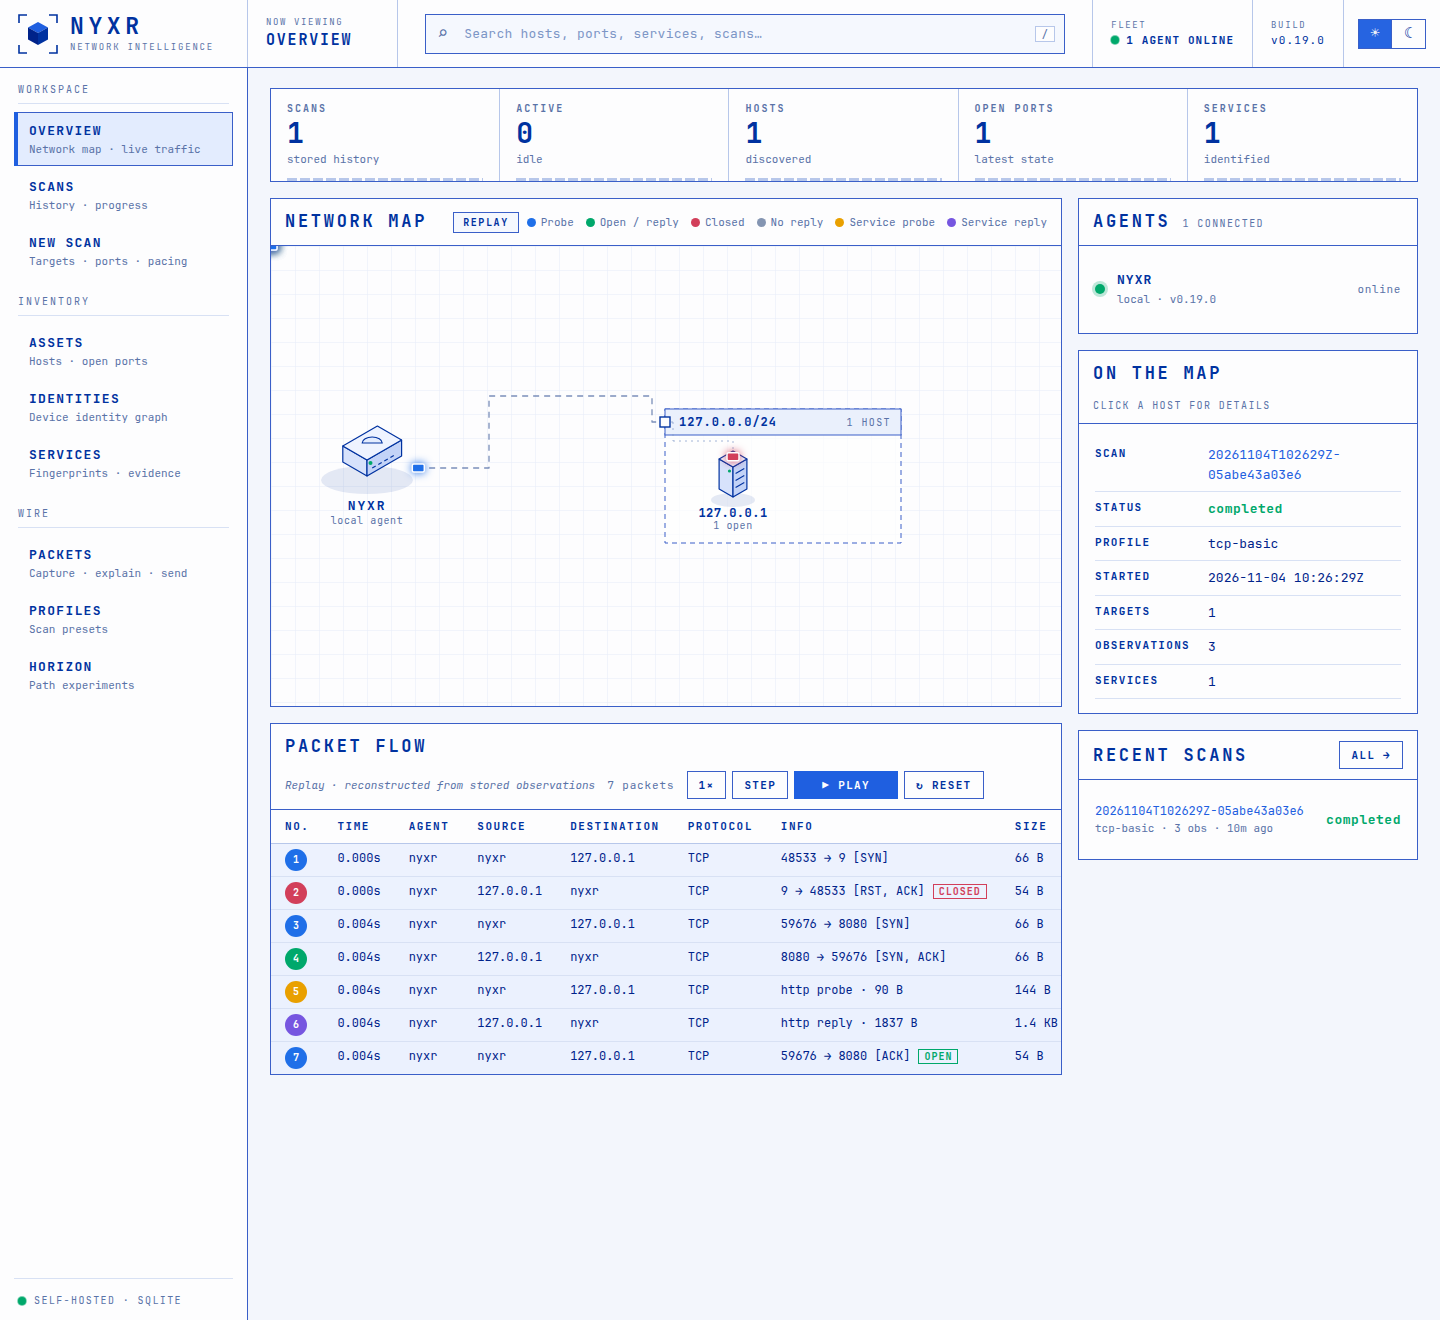
The screenshot is v0.19.0 after a connect scan of 127.0.0.1. Port 9 was closed. Port 8080 was a local http.server, identified as SimpleHTTP 0.6. The packet table is that scan replayed. The source ports in it are example values; the explainer marks those fields.
What stayed
The server is still one unprivileged process, loopback by default. A non-loopback listener still needs a bearer token of at least 16 characters. Root, or raw-socket capabilities, still need --allow-privileged, and raw packet I/O still belongs to nyxr-packetd. The same pages are in a rail: scans, new scan, assets, identities, services, packets, profiles.
Search, and a theme switch
The UI follows the system theme until you pick light or dark. The choice stays in the browser.
Search completes hosts, ports, services, products, scans and pages, and marks every match. / or Ctrl/⌘+K focuses it, Tab fills the highlighted suggestion, Enter opens it. 80 lists tcp/80 and udp/80 first, then other open ports that contain 80, then addresses that contain those digits. A dot or a colon is read as an address, so hosts come first. Closed-only ports stay hidden unless you asked for that exact port.
The map
The counters stay on Overview: scans, running scans, hosts, open ports, identified services. Under them is the map. One local agent, named nyxr, sits on the left. Targets sit on the right, in /24 frames for IPv4 and /64 frames for IPv6. A frame groups addresses. It does not mean a router is there. nyxr runs one local agent today. An observation whose agent field names another agent adds that agent to the map and the list.
While a scan runs, each streamed observation becomes the packets that produced it, and they travel between the agent and the target. Otherwise the map replays the latest scan once, with play, pause, step, reset and speed. Click a host for its ports, to open it in assets, or to start a service scan of what is already open.
Scan detail uses the same map. Each target is one row, with open, closed, filtered and service counts, and cancel still keeps partial results.
Assets is one row per host now, not a flat list of open ports. Open the row for the ports. Filter by address, CIDR, range, an exact port such as tcp/80, or a service. Scan → starts a --known-open service scan for that host, and the header button does it for the scope.
Which bytes were really captured
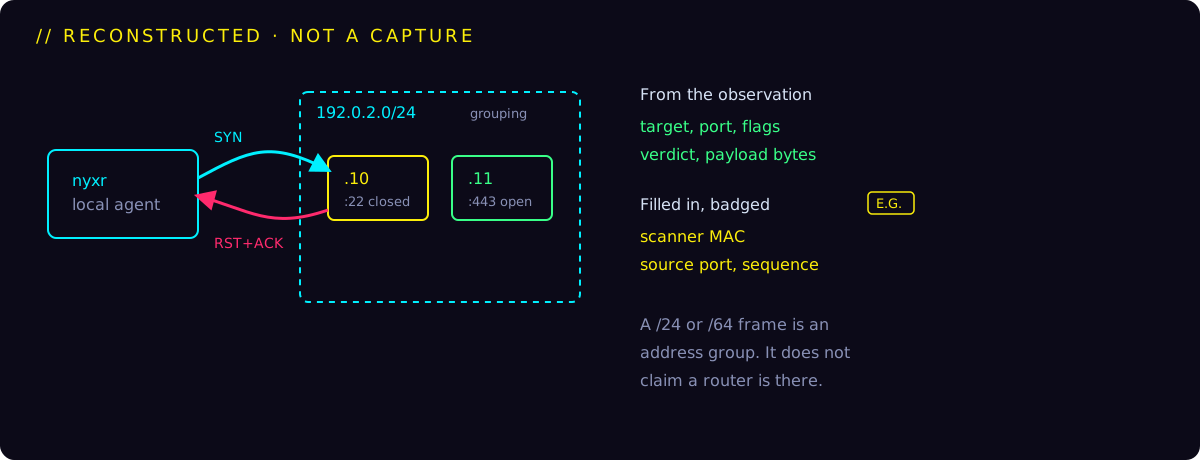
The map’s packets are built in the browser from observations. A TCP result becomes a SYN and a SYN-ACK or RST-ACK, then the final ACK for a connect scan or a RST otherwise. UDP becomes a probe and either a reply or an ICMP port unreachable. ARP becomes who-has and, if the host is up, the reply. NDP becomes a neighbor solicitation and, if the host is up, the advertisement. A service observation with retained bytes becomes those payloads, at most six exchanges and 1400 bytes each.
The target, port, flags, verdict and retained payload come from the scan. The scanner’s MAC, its source port and the sequence numbers are not recorded, so they are filled in and badged E.G. On loopback, or when the agent record has an address, that address is used and is not badged. Captured frames never take this path. The packets page and evidence packets use the same explainer with nothing marked as an example.
Click a row and the explainer replaces the map: a layer bar sized by bytes, every field with a short note, and a hex dump that highlights with the field.
On the packets page a captured frame opens in the same explainer, and Clone copies it into the hex editor. Watching still needs --packetd. Sending the edit, or resending the original, still needs --allow-packet-send, and packetd can still reject the frame.
From a claim to the bytes
v0.19.0 adds nyxr evidence (show, clone, replay) and the Trace evidence page. A service observation with retained exchanges links there. You get the claim, the planner decisions, and each exchange: probe, layer, match, completeness, truncation, byte counts and packet IDs.
Packets always have a status. available means the flow was indexed and nothing was dropped. partial means packets exist, but the index was truncated or the capture dropped frames. unavailable means no --pcapng, a scan still running, a pruned scan, or no packets indexed for this flow. A gap is written out. It is not an empty table.
Explain loads a frame only after the server checks the capture’s recorded size and SHA-256. A file that no longer matches stays unavailable. Open in editor puts the frame on the packets page. Clone probe returns an editable Protocol DSL draft and writes nothing until you run it. Dry run returns the plan. Offline replay feeds the retained response to the parser and sends nothing. Live resend asks you to confirm, needs the original target, an API token and serve --allow-packet-send, is refused for an ot-safe scan, and is stored as its own scan. The original observation does not change. A TLS-layer exchange can be cloned. A native QUIC, DTLS or HTTP/3 handshake cannot.
IPv6, and HORIZON
The scanner in this release can SYN-scan IPv6, with the source address scoped and NDP used to resolve a neighbor. On the map that is a /64 frame, and an NDP observation drawn as a solicitation and, when the host answered, an advertisement.
The HORIZON page arrived in v0.18.0. It lists retained runs, can cancel one, and can engage the kill switch after you confirm. That stops every run, and the API refuses new ones until the process restarts. A run’s page shows status, a trial timeline, the comparison, the evidence-graph hypotheses and the report’s limitations, and it can download the sealed report. Runs are created through the API, not from this UI, and HORIZON stays off until you enable it at startup.
nyxr serve # http://127.0.0.1:8484Install paths and the rest of the scanner are on the project page. The UI follows the web UI and API guide. The evidence page follows evidence navigation and probe replay.